(This is part 3 of the “Stages of the Anthropocene, Revisited” Series (SotA-R).)
Drought is (obviously) not the only kind of disaster caused by climate change, although it is probably the most severe in terms of its (long term) effects. Other types of “natural” disaster that have to be taken into account given the purpose of this series include heatwaves, storms, and other forms of extreme weather. The focus in the present article will be on heat and tropical cyclones (including hurricanes and typhoons).
heat
While there are several papers projecting aspects of heat as an effect of climate change, I haven’t seen any that focus on the near future. What is needed to predict stage 1 of the anthropocene, however, are maps of heat in the 2030s and 40s. Lacking those, we’ll have to do with approximations. A handful of papers model heat under various RCPs near the end of the current century, and the maps resulting therefrom are probably the closest we can get – at least for now. In RCP4.5, global warming is expected to reach 1.8°C (with the usual uncertainty margins) by the end of the current century. According to more recent warming forecasts,1 we’ll reach that level of warming around the year 2040, so if we assume that these heat projections just depend on average warming, then the RCP4.5-end-of-century projections can be used as a proxy for the short term projections we need.
The first thing to look at is expected average maximum wetbulb temperature, which takes both heat and humidity into account. Wetbulb temperatures over 35°C are lethal for humans and most other mammals. Even doing nothing in such circumstances will lead to overheating and death, unless one can find a way to cool down. However, much lower wetbulb temperatures can also be fatal, especially when you are doing manual labor, but also for elderly people whose bodies are less capable of regulating heat. When wetbulb temperatures exceed 27°C mortality rates start to increase significantly, and with every additional degree the number of deaths further increases. Extreme heatwaves cause death waves. Such heat-related deathwaves have already occurred in France, Russia, Japan, and elsewhere in the past two decades, and they are expected to become much more frequent and severe.2
A projection of maximum monthly average wetbulb temperatures under RCP4.5 (as well as other scenarios) can be found in a paper by David Newth and Don Gunasekera.3 Notice that this is a model of monthly averages and that this implies that there may be occasional peaks that are several degrees higher. The following map is based on one of the maps in their paper:
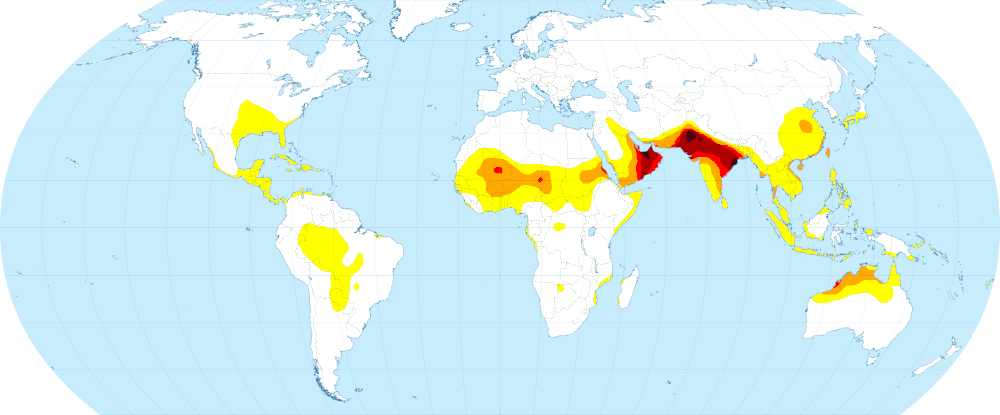
In the present situation, average monthly wetbulb temperatures exceeding 27°C (yellow in the map) occur only in small parts of India, the Arabian peninsula, and the Sahel – that is in some of the areas that are orange or red in the above map. The coming two decades will see a significant increase of these areas experiencing severe heatwaves (far worse, that is, than the heatwave that killed approximately 14.800 people in France in 2003, for example). Even more concerning than the expansion of the “yellow” area is the red and dark red area in northern India and the southeastern Arabian peninsula. A monthly average wetbulb temperature of 30°C will already kill significant numbers of people, but an occasional spike of a few degrees could result in millions of deaths in northern India. I don’t know the likelihood of a +5°C spike in the warmest month, but in that area this would result in a wetbulb temperature over 35°C. If that spike would last much more than two hours, anyone who wouldn’t be able to find refuge in some cool spot would be slowly cooked from the inside and die. Close to a billion people live in the dark red area in the map. How many of those would die in such a scenario? Half of them? Even more? In any case, the death toll would be unimaginable, and even far less extreme scenarios are likely to lead to significant heat-related death waves.
It is, moreover, not just relatively brief exposure to extreme heat that kills, but long-term exposure to less extreme heat can be just as deadly – albeit more slowly. It has been shown, for example, that long-term exposure to heat can lead to kidney failure.4 Hence, in addition to a map of expected extreme heat events (i.e. the map above), we also need a map showing long-term exposure to the kind of heat stress that is likely to have long-term, potentially fatal health effects, or that could lead to (also potentially fatal) heat stroke in people doing manual labor. Such a map can be based on a projection under RCP4.5 for the end of the current century in a paper by Xi Chen and colleagues.5 This is what it looks like:
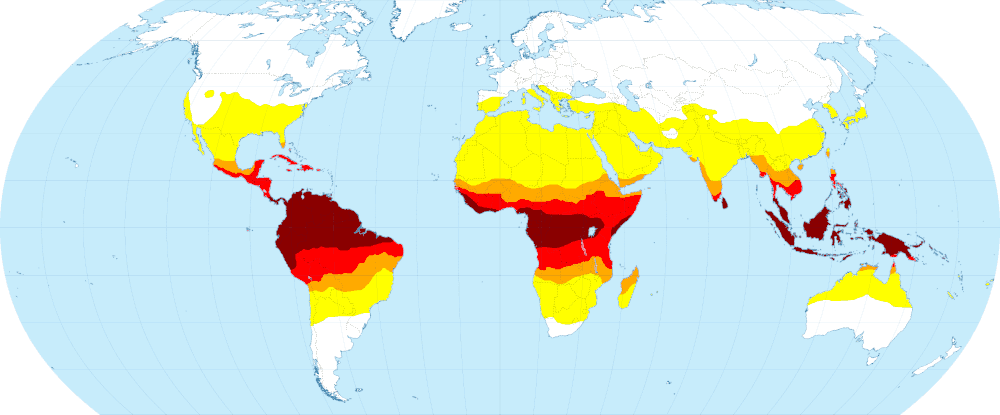
The yellow area will have at least one month per year with severe heat stress, which will be unpleasant, but not nearly as problematic as life in the darker colored areas. Orange: more than one quarter of the year with severe heat stress. Red: one third. Dark red: more than half the year. Hence, in those dark red areas, more often than not it will be so hot that there is a risk of heat stroke if one does manual labor (especially outside in the sun), so hot that there is a high probability of kidney damage and possibly other kinds of health effects that cut one’s life expectancy short, so hot that much of the economy – including the production and distribution of food – grinds to a halt. And the less-dark-but-still-red areas are experiencing the same conditions once every three days on average.
There is, by the way, a striking difference between the two maps above: there is very little overlap between the worst affected areas in the first and second map. The areas that are expected to suffer the worst heatwaves are not the same as the areas that are expected to have the most dangerously hot days. Or in other words, different areas are affected by extreme heat in different ways, and consequently, taking only one of those into account would result in an understatement of the problem of severe heat. There are, furthermore, also significant differences between these maps and maps that focus on specific regions. The expected heat maps of just China or India in a number of recent papers look quite, different, for example.6 Unfortunately, they do not suggest a more optimistic view. In the contrary, if those regional maps are right, heat might be an even bigger problem (especially in China) in those two countries than the above two maps suggest.
If – as in the previous episode – we focus on areas with higher population density, then four areas jump out. Northern South America – Columbia and Venezuela especially – and much of surrounding Latin America, as well as Indonesia and part of the rest of Southeast Asia are projected to experience severe heat stress for much (if not most) of the year, which will significantly reduce life expectancy in those regions, but which will also severely impact their economies. Northern India, and – probably to a much lesser extent – Southeast China will be hit by deadly heatwaves,7 leading to mortality waves and economic costs (because people can’t work as hard during a deadly heatwave). Obviously, India (as well as part of Pakistan) is much redder on the map, and thus much more in danger in this respect, but the part of China that will be affected has such a vast population that it cannot be ignored.
cyclones
Tropical cyclones include hurricanes (in the Atlantic) and typhoons (in the Pacific). There is little certainty with regards to the future of cyclones, but since they are “fed” by warm surface water, warmer oceans will almost certainly lead to stronger cyclones. Michael Wehner and colleagues, for example, found that even at 1.5°C or 2.0°C of average global warming (expected to be reached around 2030 and 2045, respectively8) “the most intense tropical cyclones become more frequent and more intense, while simultaneously the frequency of weaker tropical storms is decreased”.9
Because of the extent of uncertainty involved in cyclone prediction (but also because there is still much unknown about the oceans’ response to warming), there are – at least as far as I know – few if any good maps showing expected cyclones intensity in the 2030s and 40s. There are maps, on the other hand, of cyclone tracks since 1950, such as this one:
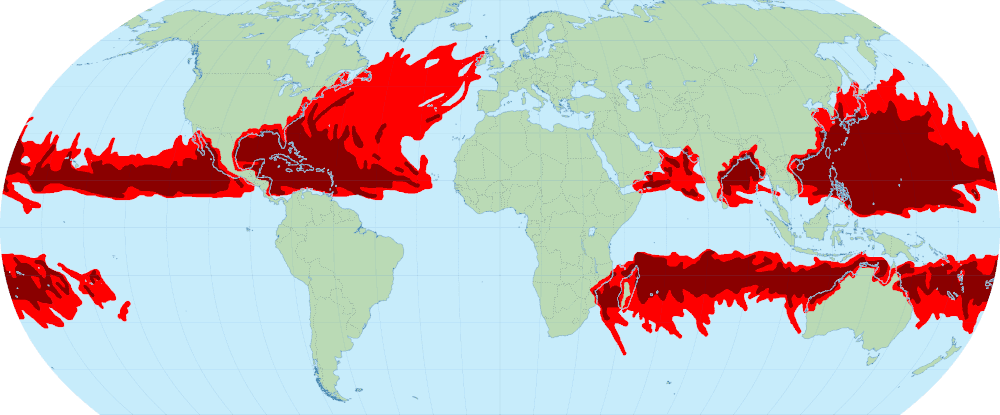
Red areas in this map have experienced at least one tropical cyclone in the past 70 years; dark read areas have experienced at least one category 3 or stronger cyclone. What this map doesn’t show is the frequency of cyclones; just where they occur. (I haven’t seen a map of cyclone frequency, nor of cyclone damage.) A paper by Kieran Bhatia and colleagues, however, does give an indication of where we can expect the biggest changes with regards to cyclone frequency.10 The Caribbean might experience a few more hurricanes, and Madagascar and India a few less cyclones, but these changes in frequency (!) appear to be relatively subtle (which doesn’t mean that the changes in strength and effects will be subtle as well, unfortunately). In the northwestern Pacific, on the other hand, the number of typhoons is expected to increase significantly, which will mainly affect the Philippines, Taiwan, and part of the Chinese coast, especially the extremely densely populated coast of the North China Plain with the coastal mega-city of Shanghai. The Philippines, which are expected to be hit the hardest, might experience an average of 7 tropical cyclone days per year.
What kind of damage a cyclone does differs from location to location, by the way. Caribbean islands can be flattened completely, as we have seen in the past years, but in most cases the worst damage isn’t done by wind but by rain. Cyclones bring enormous amounts of rain, and it is expected that cyclones will not just become windier, but also much wetter. Cyclones, thus, cause floods, often even further inland (where the wind has lost much of its force). In East Asia, China, Japan, Korea, Taiwan, and the Philippines will all experience significant increases in typhoon-related floods. The same will be true in other cyclone-affected regions, even if the expected increase in the number of typhoons will be less (or even negative). Most worrying in this respect is Bangladesh, which is only rarely hit by cyclones, but which has a very densely populated and very low coast that is prone to floods. Rising sea levels make the situation even worse. It is by no means unlikely (perhaps even probable) that a major cyclone will lead to floods, famines, and epidemics affecting 30 million or even more people leading to major refugee flows to other parts of Bangladesh, India, and Myanmar, which all will be experiencing their own problems, and which aren’t very likely to welcome significant numbers of Bangladeshi refugees.
It is also worth noting, by the way, that some of the regions identified in the previous episode in this series as likely to experience extreme drought are also hit by (occasional) cyclones. This combination is particularly damaging for agriculture, because when too much rain hits perched soils, weakened plants cannot make use of that excess water and instead, the fertile top soil just washes away. Drought plus occasional extreme precipitation turns out to be even worse than drought on its own.
If you found this article and/or other articles in this blog useful or valuable, please consider making a small financial contribution to support this blog, 𝐹=𝑚𝑎, and its author. You can find 𝐹=𝑚𝑎’s Patreon page here.
Notes
- Wangyang Xu, Veerabhadran Ramanathan, & David Victor (2018), “Global Warming Will Happen Faster than we Think”, Nature 564 (6 December 2018): 30-32.
- I have written about this topic before (and in more detail) in (a.o.) On the Fragility of Civilization.
- David Newth & Don Gunasekera (2018). “Projected Changes in Wet-Bulb Globe Temperature under Alternative Climate Scenarios” Atmosphere 9.187.
- Oriana Ramirez-Rubio et al. (2012). “An Epidemic of Chronic Kidney Disease in Central America: An Overview”, Journal of Epidemiology and Community Health 67.1: 1-3.
- Xi Chen et al. (2020). “Changes in Global and Regional Characteristics of Heat Stress Waves in the 21st Century”, Earth’s Future 8: e2020EF001636.
- See, for example: Suchul Kang & Elfatih Eltahir (2018). “North China Plain Threatened by Deadly Heatwaves Due to Climate Change and Irrigation”, Nature Communications 9.2894. Eun-Soon Im, Jeremy Pal, & Eltafih Eltahir (2017). “Deadly Heat Waves Projected in the Densely Populated Agricultural Regions of South Asia”, Science Advances 3.e1603322. Vimal Mishra et al. (2017). “Heat Wave Exposure in India in Current, 1.5°C, and 2.0°C Worlds”, Environmental Research Letters 12.124012.
- But note that Kang & Eltahir (see previous footnote) expect deadly heatwaves in the even more densely populated North China Plain.
- Xu, Ramanathan, & Victor (2018), “Global Warming Will Happen Faster than we Think”.
- Michael Wehner et al. (2018). “Changes in Tropical Cyclones under Stabilized 1.5 and 2.0 #C Global Warming Scenarios as Simulated by the Community Atmospheric Model under the HAPPI Protocols”, Earth System Dynamics 9: 187-95, p. 187.
- Kieran Bathia et al. (2018). “Projected Response of Tropical Cyclone Intensity and Intensification in a Global Climate Model”, Journal of Climate 31: 8281-303.