One of the oldest quantitative claims in climate science is that the likely global average temperature increase due to a doubling of atmospheric CO₂ is between 1.5 and 4.5°C. This range dates back to 1979 and has remained unchanged until yesterday with the publication of a refined estimate by a large group of researchers in the Review of Geophysics.1 Based on three different and independent lines of research (modeling, historical records, and paleoclimate records), they conclude that the range is between 2.6°C and 3.9°C. This had lead some media to proclaim that both optimists and “doomsayers” have been proven wrong,2 but that conclusion is a bit too easy. As a counterweight to overly simplistic media coverage, I’ll make an attempt here to briefly explain what the main finding of the paper by Sherwood and colleagues is, and what it implies.
The paper is concerned with estimating the climate sensitivity S. S is a temperature range, which is defined such that there is a 66% probability that the global average temperature increase resulting from a doubling of atmospheric CO₂ relative to the pre-industrial level of 280 ppm (parts per million) will be in between its lower and upper bounds. Hence, there are two essential conditions to the 2.6~3.9°C range that should not be overlooked. Firstly, it concerns the expected effects of a doubling of atmospheric CO₂ to 560 ppm. (It is about 416 ppm now.3) Secondly, there is a 66% chance of staying in that range. (Actually, there is a third “condition”, but we’ll get to that below.) The following graph combines some numbers and parts of graphs from the paper into one summary graph.
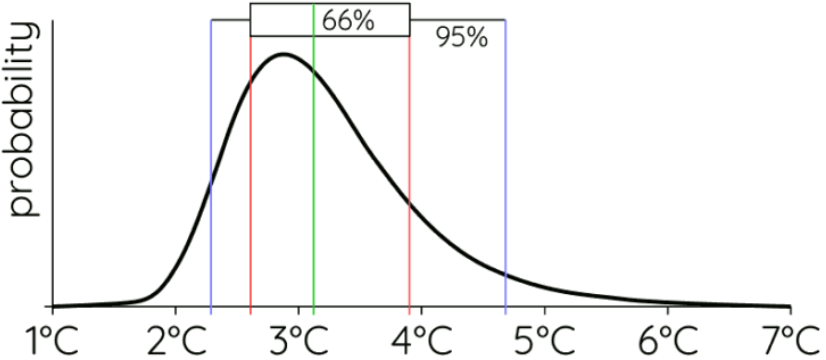 The thick black line in the graph shows the probability of different global average temperature increases due to an increase to 560 ppm. More useful than that are the colored vertical lines and the boxplot at the top. These specify that there is a 66% probability of staying between 2.6 and 3.9°C, a 95% chance of staying between 2.3 and 4.7°C, and that the median expected temperature increase is 3.1°C.
So, does this mean that the IPCC target of 1.5°C is impossible because it is below the lower end of the range (of 2.6°C, or 2.3°C in case of the 95% range)? And does that mean that pessimistic scenarios of increases of 6°C or even more are impossible as well?
Actually, no, it doesn’t imply either of those.
Again, this measure of climate sensitivity S refers specifically to a scenario in which atmospheric CO₂ is doubled. If we stay well below 560 ppm, the global average temperature increase will be lower as well. If we far exceed it, then it will get hotter. In Stages of the Anthropocene I estimated that we’d reach about 1000 pm by the middle of the next century, but I no longer believe that this is plausible. The effects of climate change will be so disastrous that CO₂ emissions will start to decrease substantially much sooner and much more. If there are no disasters with a global impact and most of the world keeps it promises of CO₂ neutrality by 2050, we’ll end up somewhere in the range of 700 to 800 ppm. If suddenly the global elite is exterminated by some inexplicable disease and replaced with more benevolent rulers who seriously address the problem, we might end up somewhere in the 450 to 500 pm range.
There is no guarantee whatsoever that we’ll end up with an atmospheric CO₂ level in the neighborhood of that assumed of climate sensitivity S. Most likely, we’re going to significantly overshoot it, meaning that the lower bound of likely temperature increase will be higher as well. But there is a hypothetical possibility of remaining well below it as well. What would be needed to estimate the likely temperature increase independent from the condition of one particular scenario would be a graph like the one above for every possible scenario plus an estimate of the likelihood of that scenario (and some mathematics to combine those data into a single graph). Such data is not available (and probably never will be).
Furthermore, there is a second reason why S may not be relevant as a prediction, especially on the long term. (This is the aforementioned “third condition.”) While S takes many important feedback effects (such as clouds and albedo effects) into account, it is a measure specifically of the direct temperature effect of a doubling of atmospheric CO₂ in the current Earth system. What it does not take into account is that an increase in temperature, or an increase in CO₂ itself, may lead to significant changes in the Earth system. It ignores tipping points, it ignores effects like natural greenhouse gas releases due to increasing temperatures (melting permafrost is the most obvious example), and it ignores effects of ocean acidification and anoxia, and so forth. The measure of S assumes that aside from temperature, almost everything else stays the same.
In other words, what these findings mean is that if we double atmospheric CO₂, the short term temperature increase will probably be between 2.6 and 3.9°C, but they are silent about the long term. If a temperature increase in that range will lead to methane and CO₂ releases from natural sources that lead to a further increase of several 100s ppm, then the planet will continue warming well beyond the upper bound of that range. The classic study on tipping points by Timothy Lenton and colleagues suggests that warming in the range of 3 to 5°C triggers most tipping elements, and Sybren Drijfhout and colleagues have more recently implied that about two thirds of known tipping points are triggered at temperature increases below 3°C.4 In other words, if we warm up the planet to somewhere in the range predicted by Sherwood and colleagues (noting again the 560 ppm CO₂ condition), then the Earth system will almost certainly be “tipped” into a different state – a state very different from the one that has created the living conditions for mankind – and will continue warming well beyond the “upper bound” of 3.9°C.
So, in conclusion, then, while the new estimate of S is very valuable information to estimate the likely (short term) temperature increase due to CO₂ emissions, there is absolutely no guarantee that the planet will remain in that range. Given the present situation, it seems more likely that we’ll overshoot it (by emitting more CO₂ than S assumes), and even if we don’t, we’ll pass several tipping points on the way, assuring that warming won’t stop once we have reached a temperature within that range. Furthermore, even if due to some miracle we manage to limit the average global temperature increase to 2°C or slightly more and manage to avoid the worst tipping points,5 then we’d still be in the range that may cause a cascade of refugee flows and societal collapse due to a significant rise in the frequency and severity of natural disasters.6 Taking that into account, the lowering of the upper range is pretty much irrelevant, but the increase of the lower range of S (from 1.5°C to 2.6°C) only underlines how close we are to that cascade of collapse.
If you found this article and/or other articles in this blog useful or valuable, please consider making a small financial contribution to support this blog 𝐹=𝑚𝑎 and its author. You can find 𝐹=𝑚𝑎’s Patreon page here.
Notes
- S. Sherwood et al. (2020), “An assessment of Earth’s climate sensitivity using multiple lines of evidence”, Review of Geophysics, published online on July 22.
- See, for example, this article in the Guardian.
- See: www.co2.earth
- Timothy Lenton et al. (2008), “Tipping Elements in the Earth’s Climate System”, PNAS 105.6: 1786-1793. Sybren Drijfhout et al. (2015), “Catalogue of Abrupt Shifts in Intergovernmental Panel on Climate Change Climate Models”, PNAS: E5777-E5786.
- This may actually be impossible already. One important tipping point is the Amazon turning from rain-forest into savanna. Widespread deforestation in the area has already made this a near certainty.
- See The 2020s and Beyond and A Theory of Disaster-Driven Societal Collapse and How to Prevent It.